

RICE prioritization scores every feature or project with one formula, (Reach × Impact × Confidence) ÷ Effort, so you can rank a messy backlog by expected value instead of gut feeling. The payoff is a repeatable, defensible number that turns “I think this matters” into a comparison you can actually argue with data. This guide walks through the math, a worked example you can drop into a spreadsheet, and the mistakes that quietly wreck the ranking.
TL;DR:
- RICE prioritization provides a data-driven way to compare projects, but small errors in Effort estimation can significantly alter rankings.
- Reaching 10,000 users with high impact and confidence can yield nearly identical scores to smaller projects with less reach but lower effort.
- Accurate Effort estimates from engineering are crucial, as a 30% discrepancy often indicates scope uncertainty rather than wrong math.
- Using RICE effectively requires aligning Impact with clear KPIs, honest Confidence ratings, and documenting all assumptions for future review.
- RICE works best for ranking diverse backlog items; it is less suitable for narrow, single-release scoping or projects driven mainly by emotional appeal.
Table of Contents
- What Is the RICE Prioritization Framework?
- How Do You Estimate Reach, Impact, Confidence, and Effort?
- RICE Formula and a Worked Example You Can Copy
- How Do You Run RICE Scoring as a Team Routine?
- Why Do RICE Rankings Sometimes Look Wrong?
- When Should You Use RICE Instead of Other Prioritization Frameworks?
- Optiostation’s Take on RICE for Small Teams
- Adopt RICE This Week
- An Editorial Take on Making RICE Actually Work
- Sources
What Is the RICE Prioritization Framework?
Intercom built RICE to solve a specific headache: comparing wildly different project ideas without falling back on whoever argued loudest in the meeting. The team needed one number that let a backend migration get weighed against a marketing campaign against a UI tweak.
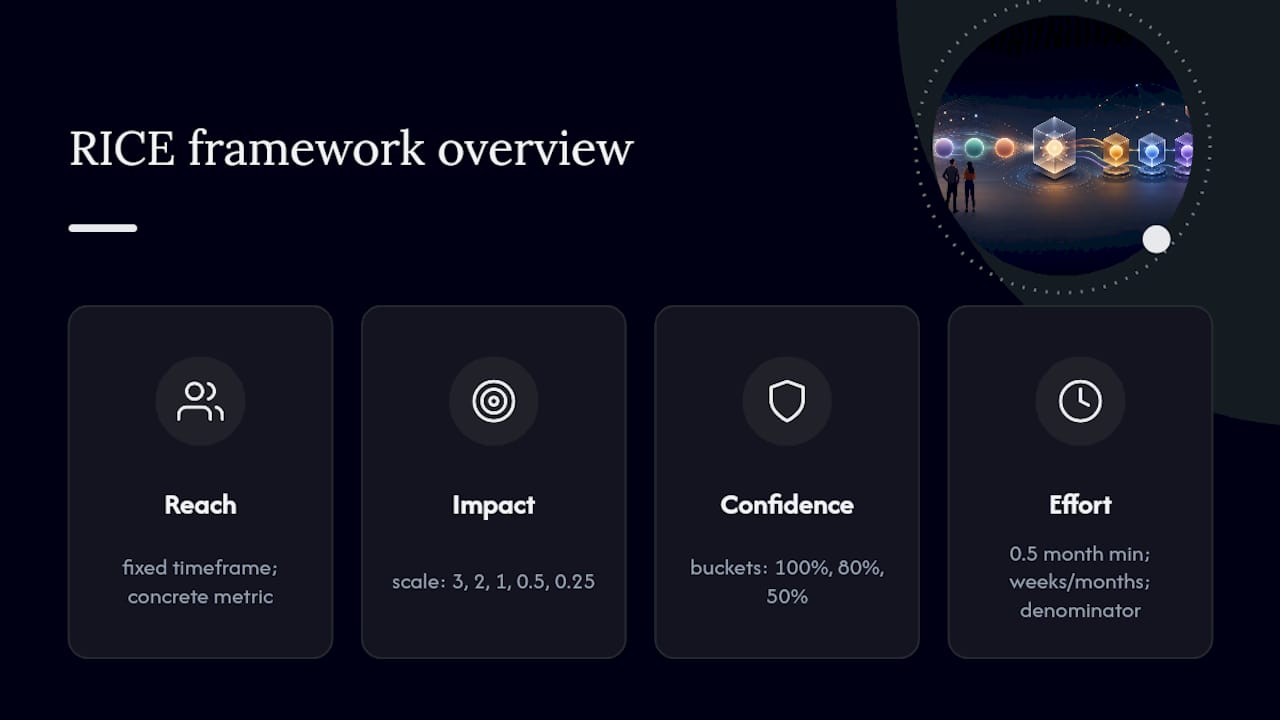
RICE breaks that number into four inputs:
- Reach: how many people the work touches in a set period (customers per quarter, sessions per month).
- Impact: how much it moves the needle for each person it reaches, on a fixed scale.
- Confidence: how sure you are about your Reach and Impact guesses.
- Effort: how many person months it takes to ship.
ProductPlan frames RICE as a bias-reduction tool that helps product managers defend roadmap calls to executives and engineering leads alike. It works best as the primary input when you’re comparing initiatives of different types and sizes within the same roadmap, not when you’re scoping a single release or judging emotional appeal.
How Do You Estimate Reach, Impact, Confidence, and Effort?
Each factor has its own estimation logic, and sloppy inputs here are where most RICE scores go wrong.
Reach needs a fixed timeframe and a real metric. Pick a quarter or a month, then count something concrete: page views times conversion rate, or “users who will encounter this flow in Q2.” A checkout redesign reaching many users is a very different bet than a settings page tweak reaching far fewer.
Impact maps to Intercom’s canonical scale: 3 for massive impact, 2 for high, 1 for medium, 0.5 for low, 0.25 for minimal. Tie the score to a specific KPI. A feature expected to lift activation meaningfully might earn a 2; a cosmetic fix that barely nudges retention earns a 0.25.
Confidence works in three buckets: 100% when you have solid data behind Reach and Impact, 80% when the evidence is decent but incomplete, and 50% when you’re mostly guessing. Confidence is a humility check, not a formality, and inflating it is the single fastest way to break the ranking.
Effort gets measured coarsely in person weeks or person months, with most guides recommending a 0.5 person month minimum unit rather than chasing precision. Because Effort sits in the denominator, small errors there swing the final score far more than a rounding error in Reach ever will.
Pro Tip: If two team members estimate Effort for the same feature and land more than 30% apart, that gap usually means the scope isn’t defined yet, not that someone’s math is wrong.
A feature reaching 10,000 users with Impact 2 and Confidence 80% scores very differently at 2 person months of Effort versus 4. Small denominator shifts change rank order more than most people expect.
RICE Formula and a Worked Example You Can Copy
The formula, spelled out with Confidence entered as a decimal:
RICE Score = (Reach × Impact × Confidence) ÷ Effort
Walk through one feature: a checkout autofill tool projected to reach 8,000 users this quarter, with Impact scored at 2 (high), Confidence at 80% (0.8), and Effort at 2 person months.
- Multiply Reach by Impact: 8,000 × 2 = 16,000.
- Multiply that by Confidence: 16,000 × 0.8 = 12,800.
- Divide by Effort: 12,800 ÷ 2 = 6,400.
Compare that to a second feature: an in-app referral prompt reaching 2,000 users, Impact 3, Confidence 50% (0.5), Effort 0.5 person months. That comes out to (2,000 × 3 × 0.5) ÷ 0.5 = 6,000. Nearly identical scores, despite one feature reaching four times as many people.
A spreadsheet built for this needs these columns:
| Feature | Reach (per qtr) | Impact | Confidence | Effort (person months) | RICE Score |
|---|---|---|---|---|---|
| Checkout autofill | 8,000 | 2 | 0.8 | 2 | 6,400 |
| Referral prompt | 2,000 | 3 | 0.5 | 0.5 | 6,000 |
Treat the resulting numbers as relative buckets, high, medium, low, rather than precise ordinals. A worked example from ProductOS shows the same pattern: low-effort, moderate-impact features regularly outscore ambitious, high-effort ones, which is often the whole point of running the exercise.
How Do You Run RICE Scoring as a Team Routine?
RICE only stays useful if it’s a habit, not a one-off spreadsheet exercise someone abandons after Q1. Anchor every Impact score to a named north-star metric before anyone starts scoring, so two people aren’t secretly optimizing for different outcomes.
Pull Reach numbers from analytics (actual traffic, actual conversion data) and pull Effort estimates from the engineers who’ll build the thing, not from the PM guessing at scope. Score as a cross-functional group, design, engineering, and product in the room together, because a number one person invents alone is a number one person can quietly inflate.
- Add a notes column next to every score explaining the assumption behind it.
- Revisit Confidence after any experiment, user test, or launch that changes what you actually know.
- Run a pilot RICE pass on five to ten items before rolling it out across the whole backlog.
- Recalculate scores quarterly, or immediately after major new research lands.
Pro Tip: Keep a running “assumptions” log for every scored feature. Six months later, when a low score turns into a big miss, that log tells you which input was wrong instead of leaving you to guess.
For a one-page session checklist: pick the north-star metric, gather Reach data from analytics, get Effort estimates from engineering, score Impact against real KPI history, set Confidence honestly, document assumptions, then rank and revisit next quarter. Tools that already track your team’s time and workload, like Optiostation’s task tracking, make pulling real Effort history faster than reconstructing it from memory.
Why Do RICE Rankings Sometimes Look Wrong?
Practitioner warnings on RICE also flag underestimated Effort and double-counting Reach across overlapping features as recurring traps.
- Check whether Confidence was set honestly or rounded up to seem thorough.
- Re-verify Effort against actual engineering estimates, not the PM’s first guess.
- Look for two features quietly claiming the same user segment for Reach.
- Treat scores within 10 to 15% of each other as ties, not a strict ranking.
When a top-ranked item still feels wrong after that audit, trust the instinct and dig into the specific input driving it. And sometimes the score is right but the answer is still no: RICE isn’t a governance layer for legal obligations, contractual commitments, or dependencies that have to happen regardless of what the math says.
When Should You Use RICE Instead of Other Prioritization Frameworks?
RICE earns its keep when you’re ranking a backlog of genuinely different initiatives, a database migration against a new onboarding flow against a pricing experiment. It’s the wrong tool for narrower jobs.
- MoSCoW fits release scoping, sorting must haves from nice to haves inside a single launch.
- Kano surfaces which features create delight versus which just meet baseline expectations.
- Value versus effort matrices work for quick, low-stakes triage without building a full model.
A strong hybrid workflow: shortlist candidates with MoSCoW inside a single release, then rank the “must haves” against each other with RICE once the list gets crowded. Teams weighing broader backlog prioritization techniques often land on exactly this combination rather than picking one framework and forcing every decision through it.
Optiostation’s Take on RICE for Small Teams
Optiostation built its own internal RICE workflow around what students and young professionals actually manage, small teams, quarter-long projects, no dedicated data analyst on hand. The simplified version drops Reach to “people affected this term” and scores Effort in person weeks instead of months. Optiostation’s detailed RICE guide and templates walks through that lighter setup, and teams in adjacent fields like education technology use similar scaled-down scoring, as this IB digital platform implementation guide shows for school-based rollouts.
Adopt RICE This Week
Pilot RICE on five backlog items before touching the whole roadmap. Score them, review Effort estimates with engineering, and write down every assumption in a notes column. That’s the whole starting move: score, review, document. Optiostation’s task management guide has templates ready when you want to move scoring out of a spreadsheet and into your daily workflow.
An Editorial Take on Making RICE Actually Work
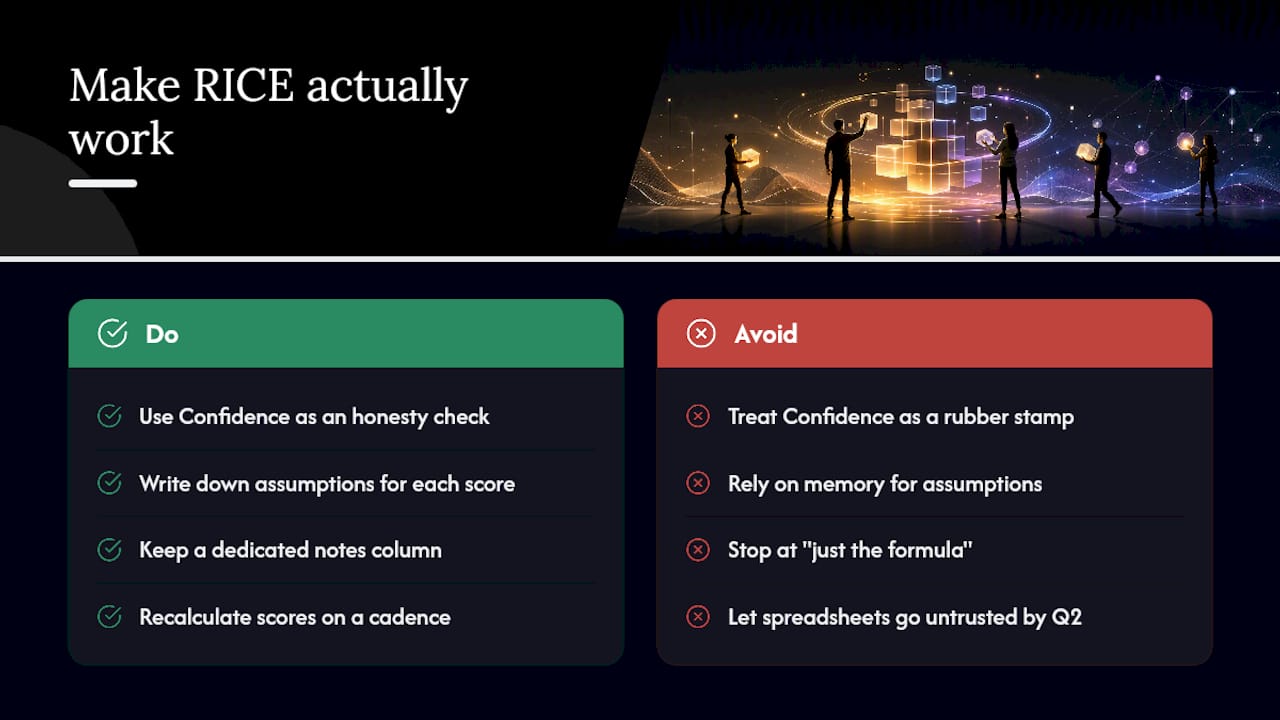
Most RICE explainers oversell the formula and undersell the discipline around it. The math is trivial, multiply three numbers, divide by a fourth. What separates teams that get real value from RICE from teams that run it once and quietly abandon it is whether they treat Confidence as an honesty check instead of a rubber stamp, and whether they write down assumptions instead of trusting memory six months later.
The conventional advice tends to stop at “here’s the formula, go score your backlog.” That’s incomplete. A formula without a documentation habit and a recalculation cadence just produces a spreadsheet full of numbers nobody trusts by the second quarter. If you take one thing from this playbook, make it the notes column, not the arithmetic. The score tells you what to build next. The notes tell you whether to believe the score at all.
— Optiostation
