

The fastest path to a working project dashboard is a one-page Excel executive template, a Google Sheets live dashboard, a single-file HTML file hosted on GitHub Pages, or a PowerPoint status slide. All four are free, customizable, and ready in under 30 minutes.
- Excel one-page executive template: Download from Sikhana Seekho — setup takes 5–10 minutes. Fill in six metric cells and a RAG status grid, and you have a working dashboard.
- Google Sheets live dashboard: Copy a public template to your Drive, connect your data, and share a live link. Allow 10–15 minutes for the initial sync setup.
- Single-file HTML template: Fork the Tr3v0r86/projects-dashboard-template repo on GitHub, enable GitHub Pages, and your dashboard is live in about 10 minutes — no server required.
- PowerPoint status slide: Download any PMO-style deck template, drop in your RAG indicators and milestone dates, and export as PDF for a sponsor update.
Format by audience: Executives and sponsors want the Excel one-pager or PowerPoint slide. Delivery teams updating data weekly do better with Google Sheets. Portfolio owners or anyone who wants a shareable live link without a paid tool should go straight to the HTML option.
Key Takeaways
A free, customizable project dashboard template can be live and accurate in under 30 minutes when you start with the right format, limit your KPIs to the four stakeholder questions, and assign a named data owner before the first update.
| Point | Details |
|---|---|
| Pick format by audience | Excel or PowerPoint for executives; Google Sheets for live team updates; HTML for a shareable hosted link. |
| Limit KPIs to four questions | Track budget location, schedule health, task progress, and current risks — cut everything else. |
| Name a data owner per metric | Every metric without a named owner goes stale within two weeks; assign ownership during setup. |
| Keep updates under 10 minutes | A sustainable weekly routine beats a comprehensive dashboard nobody maintains. |
| Optiostation for daily tracking | Optiostation’s mobile app keeps task and team data current, reducing the manual refresh burden on any template. |
Table of Contents
- What type of project dashboard template should you use?
- Where can you download free project dashboard templates?
- How do you customize a project dashboard template?
- How do you keep a project dashboard accurate week to week?
- Which metrics and visuals belong on every project dashboard?
- How do you host a single-file HTML dashboard on GitHub Pages?
- What actually works when you use project dashboards on real projects
- Optiostation keeps your project dashboard updated without the overhead
- Sources
What type of project dashboard template should you use?
The right template depends on the question your stakeholder is actually asking. A sponsor asking “Are we on budget?” needs something different from a developer asking “What’s blocked this sprint?” Picking the wrong type wastes setup time and produces a dashboard nobody reads.
| Template Type | Core question it answers | Best audience |
|---|---|---|
| Executive one-page | Where is the budget and are we on schedule? | Sponsors, PMO, steering committee |
| Project overview | What’s the overall health across scope, schedule, and risk? | Project manager, team lead |
| Gantt/milestone tracker | What’s due next and are we on track? | Delivery team, scheduler |
| Budget tracker | How much have we spent vs. planned? | Finance, project manager |
| Team workload | Who is overloaded and where are the gaps? | Resource manager, team lead |
| Portfolio dashboard | How are all active projects performing? | PMO, executive leadership |
A few practical notes on format and cadence. The executive one-page and portfolio dashboard are best for recurring weekly or biweekly stakeholder updates — they answer the four questions sponsors care about: budget location, schedule health, task progress, and current risks. Gantt and milestone templates work better as one-off snapshots or monthly reviews rather than live documents. Budget trackers need updating every time an invoice or purchase order lands, so they suit project managers who own financial data directly.
For mobile access, Google Sheets templates render reasonably well on phones and tablets without any extra work. Single-file HTML dashboards can be made responsive with basic CSS media queries. Excel and PowerPoint files are harder to read on small screens and are better suited to desktop review. If your team is checking status from their phones regularly, Google Sheets or a responsive HTML template is the practical choice.
For readers who want to see project management dashboard examples across different use cases before committing to a format, browsing a curated set first saves time.
Where can you download free project dashboard templates?
Free templates are available from several reliable sources, each with different format strengths and licensing terms worth knowing before you build on them.
Excel templates. The Sikhana Seekho one-page Excel dashboard is a clean starting point: a six-metric summary panel, a six-row RAG status grid covering schedule, budget, scope, quality, resources, and risks, all fitting on one Letter-size page. Updates take 5–10 minutes once the template is set up. For a wider selection of free Excel dashboard templates, aggregated options give you more starting points to compare.
Google Sheets templates. Search Google Workspace Marketplace or the Google Sheets template gallery. Most are free with no signup. The key advantage over Excel is real-time collaboration — multiple people can update the same file simultaneously, and you can share a view-only link with stakeholders without exporting anything.
Single-file HTML. The Tr3v0r86 GitHub repo is the cleanest free option for a live, hosted dashboard. One HTML file, optional Google sign-in, optional Todoist sync, and GitHub Pages hosting at no cost.
Full frontend UI kits. Sources like thefrontkit offer production-ready templates with kanban, sprint planning, Gantt timelines, and workload heatmaps. These are powerful but come with significantly higher setup and maintenance complexity — better suited to developers building a custom app than someone who needs a dashboard live this week.
PowerPoint. Microsoft’s own template library and Slidesgo both offer free PMO-style status decks. No formulas, no data connections — just a clean slide you fill in before each meeting.
On licensing: “free” means different things depending on the source. Truly free templates require no signup and carry no attribution requirement. Gated free templates ask for an email before download. Paid templates typically start around $10–$30 for a single file. Always check whether commercial use is permitted if you’re delivering the dashboard to a client.
| Format | Best for | Sharing method | Offline use |
|---|---|---|---|
| Excel (.xlsx) | Offline formula work, EVM calculations | Email attachment or OneDrive link | Yes |
| Google Sheets | Live team collaboration | Shareable link (view or edit) | Limited |
| PowerPoint (.pptx) | Stakeholder presentations | Email, PDF export | Yes |
| Single-file HTML | Live hosted link, no backend | GitHub Pages URL | No |
How do you customize a project dashboard template?
Customization is where most people stall. They download a template, see unfamiliar column names, and either leave the placeholder data in or start deleting things at random. A short, ordered process prevents both mistakes.
-
Define your KPI panel first. Before touching the template, write down the five or six numbers your stakeholders will ask about. Standard picks: budget burn (actual cost vs. budget at completion), percent complete, Cost Performance Index (CPI), Schedule Performance Index (SPI), open issues count, and upcoming milestone count. If a metric isn’t on that list, it doesn’t belong on the dashboard.
-
Map your data sources. Decide where each number comes from: a spreadsheet, a Jira export, a finance system, or manual entry. Note the update frequency for each. This step prevents the common mistake of building a dashboard that requires data you can’t actually get on a weekly basis.
-
Set RAG rules or conditional formatting. In Excel, use named ranges for your thresholds (e.g.,
CPI_RED = 0.85) so you can update rules in one place. In Google Sheets, use conditional formatting rules tied to cell values. Red/Amber/Green should mean the same thing everywhere on the dashboard — define it once in a legend cell. -
Wire your charts. Connect bar charts, burn charts, or Gantt rows to the data cells you’ve already mapped. Avoid charts that require manual updates — if a chart doesn’t update when you change a number, it will be wrong within two weeks.
-
Update metadata. Fill in project name, project manager name, reporting period, and status date. These fields seem minor but are the first thing a sponsor checks when they open a file they haven’t seen in two weeks.
-
Test with sample data. Enter a set of numbers that should trigger a red RAG status and confirm the formatting fires correctly. Then enter numbers that should show green. If the rules work, the dashboard is ready.
-
Save and export a backup. For Excel, save a dated copy (e.g.,
Dashboard_ProjectX_2026-06-01.xlsx) before each major update. For Google Sheets, use File > Make a copy. For HTML, commit the updated file to your GitHub repo so version history is automatic.
Pro Tip: In Excel, protect the formula cells and chart areas using the “Protect Sheet” feature, leaving only the data-entry cells editable. This takes two minutes to set up and prevents a week of debugging caused by an accidental delete.
For readers building a student or classroom version, the Excel dashboard template for students adapts these same steps to academic project structures.
How do you keep a project dashboard accurate week to week?
A dashboard that’s two weeks out of date is worse than no dashboard — it gives stakeholders false confidence. The fix isn’t more automation; it’s a clear, lightweight governance routine that takes under 10 minutes per week.
Weekly update checklist:
- Data owner updates metric cells (budget actuals, task counts, milestone dates) every Monday morning before the team standup.
- Project manager reviews RAG statuses and adds a one-line note for any amber or red item.
- A PDF snapshot is exported and emailed to sponsors, or the Google Sheets link is shared as view-only.
- The previous week’s snapshot is saved to a shared folder for audit purposes.
Governance basics: Every dashboard needs one named data owner per metric. If nobody owns a number, it goes stale. A simple rule: if a metric has no named owner by the end of setup week, remove it from the dashboard. Fewer metrics with reliable owners beats more metrics with stale data.
Common pitfalls and quick fixes:
- Stale data: Set a calendar reminder tied to the data owner’s name. If the dashboard hasn’t been updated by Tuesday noon, the reminder fires.
- Too many metrics: Portfolio managers focus on four stakeholder questions: budget location, schedule health, task progress, and current risks. If a metric doesn’t answer one of those four, cut it.
- No ownership: Name a backup data owner for each metric during onboarding. One person out sick shouldn’t freeze the whole dashboard.
Sisense’s design guidance recommends keeping dashboard updates under 10 minutes where possible — a useful benchmark for deciding whether your current setup is sustainable or needs simplification.
For teams managing several projects at once, the guide to organizing multiple projects covers governance at the portfolio level.
Which metrics and visuals belong on every project dashboard?
The metrics that matter most are the ones that answer a question before someone has to ask it. Here’s the core set, with a short definition for each:
- Budget at Completion (BAC) vs. Actual Cost (AC): How much was planned vs. how much has been spent. The gap tells you burn rate at a glance.
- Cost Performance Index (CPI): AC divided by Earned Value. Below 1.0 means you’re spending more than planned for the work completed.
- Schedule Performance Index (SPI): Earned Value divided by Planned Value. Below 1.0 means you’re behind schedule.
- Percent complete: The share of total work finished. Keep this tied to deliverables, not hours logged.
- Open issues count: Total unresolved issues, ideally broken down by severity.
- Risk count by status: How many risks are open, mitigated, or escalated.
- Milestone status: Next three milestones, each with a RAG indicator and due date.
Visualization choices. KPI cards at the top of the dashboard give executives a five-second read on overall health — this is the inverted pyramid layout that puts the most critical numbers first. Burn and burnup charts work best for delivery teams tracking sprint or phase progress. Gantt rows handle milestone timelines. Workload heatmaps, as seen in Highcharts’ project management demo, show resource allocation across team members at a glance.
Add a text label (“On Track,” “At Risk,” “Off Track”) alongside every color indicator. For dashboards shared beyond your immediate team, WCAG AA standards set the minimum contrast ratio and screen reader requirements for production use.
Pro Tip: Status chips (small colored badges next to a task or milestone name) are more scannable than full RAG rows for mobile viewers. Libraries like shadcn/ui include pre-built status chip components if you’re building a custom HTML dashboard.
How do you host a single-file HTML dashboard on GitHub Pages?
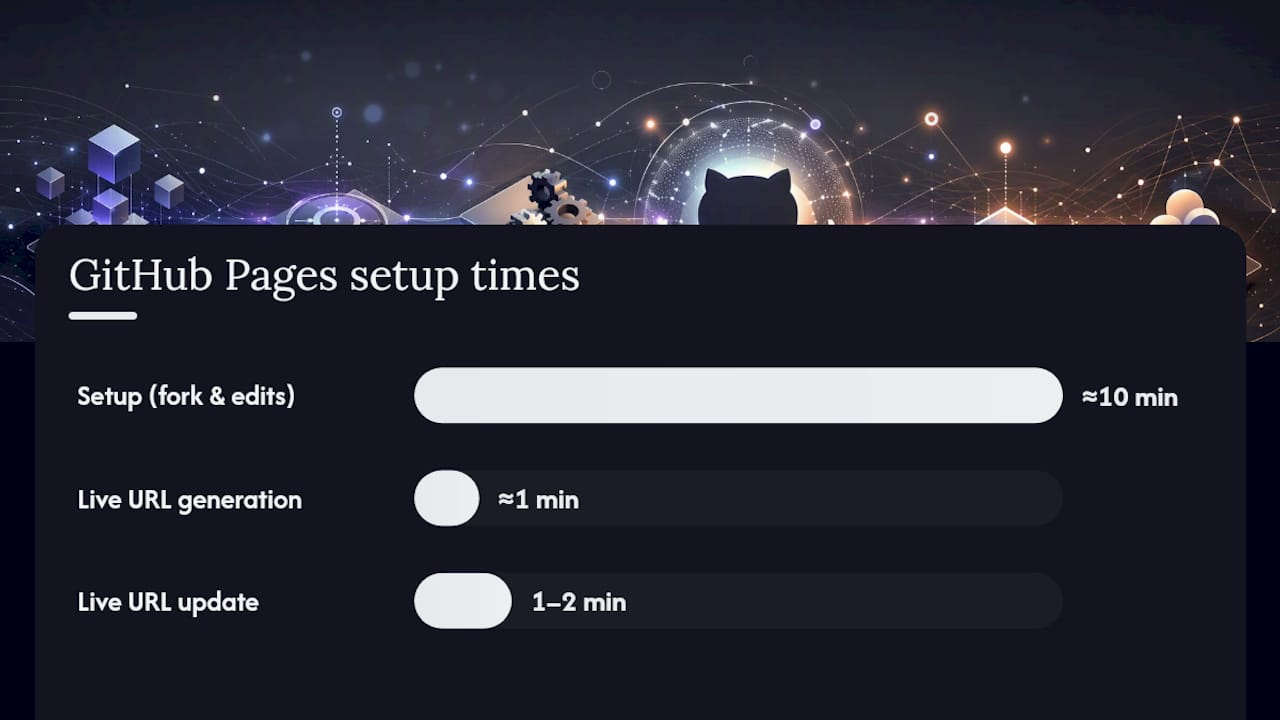
A single-file HTML dashboard on GitHub Pages is the fastest way to get a live, shareable project status link without paying for hosting or setting up a server. Realistic setup time: about 10 minutes.
Steps:
- Go to Tr3v0r86/projects-dashboard-template and click “Fork” to copy the repo to your GitHub account.
- In your forked repo, go to Settings > Pages, set the source to the main branch and root folder, and click Save. GitHub generates a live URL within about 60 seconds.
- Open
index.htmlin the GitHub editor or clone the repo locally. Replace the seed project data (project names, milestone dates, task counts) with your own. - If you want Todoist task sync, follow the README instructions to add your Todoist API token. For Google sign-in, add your OAuth client ID.
- Commit your changes. The live GitHub Pages URL updates automatically within a minute or two.
- Share the URL with stakeholders as a read-only link.
Format comparison:
- Single-file HTML: Fast to set up, free to host, no backend needed. Limitations: no real-time database, manual data updates unless you wire an API, and public repos mean the URL is publicly accessible unless you use a private repo with GitHub Pages (requires a paid plan).
- Google Sheets: Better for teams who need multiple editors and live data. More familiar to non-technical users. Harder to make look polished for executive presentations.
- Full SaaS platforms: Most feature-rich, but production-ready frontend templates with kanban, sprint planning, and workload heatmaps carry significantly higher setup and ongoing maintenance costs.
Best use cases for the HTML option: personal projects, student portfolios, small teams of two to five people, and any situation where you need a shareable link fast and don’t want to manage a subscription.
What actually works when you use project dashboards on real projects
The most common mistake isn’t picking the wrong template. It’s building a dashboard that answers every possible question instead of the four questions stakeholders actually ask: Where is the budget? Is the schedule healthy? What’s the task progress? What are the current risks?
Every metric beyond those four needs to justify its presence. A dashboard with 20 KPIs isn’t more informative — it’s a document that nobody updates consistently because it takes 45 minutes to fill in. The teams that sustain accurate dashboards over months are the ones who kept the initial setup small, named a single data owner for each metric, and set a non-negotiable weekly update time.
The second fixable mistake is treating the dashboard as a reporting artifact rather than a decision tool. If the only time anyone looks at the dashboard is during a monthly steering committee, it’s a report dressed up as a dashboard. The format should change how often decisions get made, not just how they’re presented. A weekly triage habit — even five minutes reviewing RAG statuses before a standup — is what separates a living dashboard from a file that collects dust.
Automation helps, but only after the manual process is stable. Wiring a Google Sheets dashboard to a Jira export before you’ve confirmed the right metrics are tracked is a fast way to automate the wrong thing. Get the manual version right for two weeks first, then automate the data pull.
Optiostation keeps your project dashboard updated without the overhead
Spreadsheet dashboards work well until the update routine breaks down — someone forgets to refresh the data, the file gets emailed in three different versions, and the next stakeholder meeting starts with “which one is current?”
Optiostation is built for exactly that gap. As a mobile-first task and team management app for students and young professionals, it gives you built-in task tracking, priority management, and shareable status views that stay current without a weekly manual export ritual. No formula maintenance, no version confusion.
The app pairs naturally with any of the templates in this article: use a downloaded Excel or HTML template for executive presentations, and let Optiostation handle the day-to-day task updates and team coordination that feed those numbers. Your dashboard stays accurate because the underlying task data is already organized.
Check out the best task management software guide to see how Optiostation fits into a full project tracking setup, and download the app to run your first weekly triage in under five minutes.
Sources
These sources cover the main formats discussed in this article. Check licensing terms and preview screenshots before downloading.
- Tr3v0r86/projects-dashboard-template
- Free Project Dashboard Template — Excel Download – Sikhana Seekho
- Project Management Dashboard Template | thefrontkit
Always verify that a template’s license permits your intended use, especially for client-facing or commercial deliverables.
Recommended
- Top free project management Excel dashboard templates 2026 – Optio Station: Best Project Management App for Prioritization
- Excel project management dashboard template for students 2026 – Optio Station: Best Project Management App for Prioritization
- 7 Project Management Dashboard Examples for Students and Pros – Optio Station: Best Project Management App for Prioritization
- Project Gantt Chart Template: Top 7 Picks for Teams – Optio Station: Best Project Management App for Prioritization
